Hashrate Variance: Normal Ripple or Hardware Fault
Reported hashrate on a pool dashboard is a statistical estimate built from arriving shares, not a live measurement of your silicon. That is why a 400 TH/s rig can show 372 TH/s for ten minutes and be perfectly healthy, while a machine sitting flat at 380 TH/s for a week is quietly costing real money — about $0.76 a day at current difficulty. The job is telling the two apart before the invoice does.

Key takeaways
- Share arrival is random, so relative noise scales with the window: 100 shares in a window implies roughly ±10% variation, while 10,000 shares implies about ±1%.
- A dip that disappears inside one settlement period is not a fault; at 0.000179 BTC per day for 400 TH/s, a persistent 10% shortfall costs about $45.59 a month.
- At current difficulty and a BTC/USD of 84,692, one hour of downtime on a 10 PH/s farm gives up roughly $15.83 of expected output.
- Alerts on per-worker hashrate, available through the pool's mobile app, shorten the gap between a failure and a fix — which is the only part of a fault you control.
Why the numbers move
Your miner does not report "I am hashing at 400 TH/s". It submits shares whenever a hash meets the pool's target and the pool infers your rate from how often they arrive. Because share discovery is random, the estimate jitters, and the size of that jitter depends on how many shares the window contains: the relative standard deviation is one divided by the square root of the share count. A window holding 100 shares swings about ±10%; a window holding 10,000 shares swings about ±1%.
That single relationship explains most dashboard anxiety. Short windows look volatile, long windows look flat, and neither tells you whether the hardware is healthy. What distinguishes a ripple from a fault is the direction of the deviation and whether it survives a longer window. Difficulty at 132.76 T with a network hashrate near 1,003 EH/s sets the level; share timing sets only the appearance.
Three layers of variation
Layer one is statistical: share arrival inside a short window. Layer two is thermal: a machine that throttles when intake air warms, then recovers as the room cools. Layer three is operational: a PSU at the end of its life, a loose riser cable, a firmware crash, a network switch that drops a few ports. Only the third layer is a repair ticket; the first is arithmetic, and the second is a design problem to fix with airflow and setpoints.
What changes your payout
Two things convert a hashrate deviation into money: how long it lasts, and how much hashrate it touches. At current difficulty, 40 TH/s is worth about 0.000017944 BTC a day, or $1.52; 400 TH/s is worth 0.000179 BTC a day, or $15.20; 4 PH/s is $151.97; 40 PH/s is $1,519.73. Read those as the cost of a total outage at that size — then scale by the fraction actually lost.
| Observation on the dashboard | Most likely cause | Cost at current difficulty | Action |
|---|---|---|---|
| 5–10% dip lasting minutes | Share arrival noise in a short window | None, statistically | Watch, do not touch |
| Same dip visible across two or three hourly settlements | Thermal throttling or unstable firmware | About 5% of that worker's daily output | Check intake air, fan curves, firmware |
| One worker flat at 90% while its twins are normal | Board, PSU or cable degradation | About $0.15 a day of lost output per 40 TH/s worker | Swap the machine, service the suspect part |
| All workers down at once | Power feed, switch or pool connection | $15.83 an hour on a 10 PH/s site | Network and power first, hardware last |
| Hashrate normal but reject rate rising | Latency to the pool, stale shares | Rejected work earns nothing | Change the node region you connect to |
The bottom row is the one miners skip. Rejected or stale shares are hashing you paid for and were not credited for, and they usually appear when the connection to the pool is slow rather than when a machine is broken. A pool with nodes close to your site reduces that loss without any hardware change, which is a cheaper fix than any repair.
Worked example
Consider a small site of ten 40 TH/s machines, 400 TH/s total. Expected daily output is 0.000179 BTC, about $15.20, and a clean month is roughly $456. On day three, one machine's PSU begins failing intermittently: the worker reports 36–38 TH/s for a few minutes at a time, then recovers, so the daily average slips about 10%.
If that fault runs unnoticed for 21 days, the site loses roughly 10% of 21 days of output — about 0.0003768 BTC, or $31.91. Run the same fault at 4 PH/s and the same 10% over three weeks is 0.003768 BTC, near $319.10; at 40 PH/s it is about $3,191. Even at the small end, an unplanned service visit plus the weeks of silent shortfall cost more than a replacement PSU and an hour of scheduled downtime.
The counter-example matters just as much. A 400 TH/s rig that reports 388 TH/s for eight minutes at shift change has lost nothing measurable — the deviation is inside the noise band for that window, and restarting the miner to "fix" it costs more in hashrate downtime than it recovers. The discipline is to require a deviation to persist across at least one full settlement period, and to be visible in the pool's own statistics rather than only in your monitoring tool, before treating it as real.
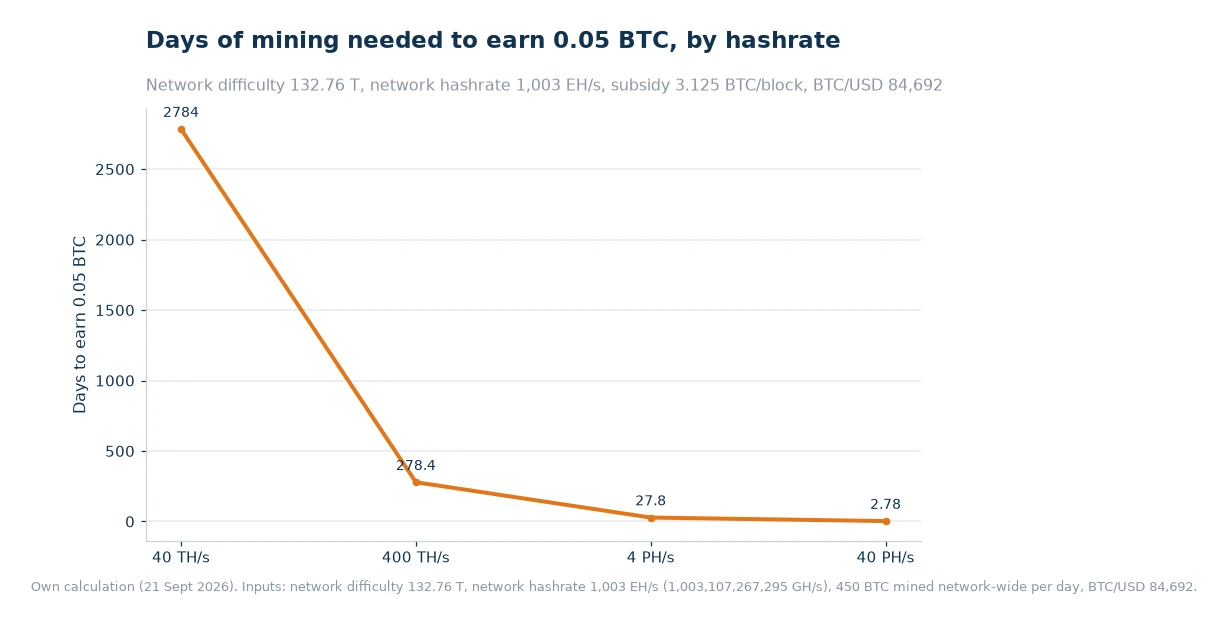
One more number settles arguments about scale. A 40 TH/s machine needs about 2,784 days of uninterrupted mining to produce 0.05 BTC, a 400 TH/s rig needs about 278 days, a 4 PH/s site about 27.8 days and a 40 PH/s site about 2.8 days. The larger the site, the faster a fault's cost accumulates — and the more a short outage is worth preventing rather than merely explaining afterwards. That is why per-worker alerting, rather than a single site-wide hashrate graph, is the feature worth configuring; the pool's own app-level monitoring and notifications exist for exactly this interval.
What to check monthly
- Realised versus nameplate hashrate. Compute the average over a full month from your settlements, not from a dashboard snapshot. A site that mines below 97% of spec is losing money every day.
- Reject and stale rates. Anything above a fraction of a percent points at connectivity. Try a closer node region before ordering parts.
- Per-worker spread. If one machine in a rack sits consistently lower than its identical neighbours, it has a hardware problem that racks of averages hide.
- Room temperature against fan speed. Rising fan RPM with flat hashrate is pre-throttling. Fix airflow before summer does it for you.
- Break-even efficiency. Recompute the J/TH threshold that still clears your power price after each difficulty change, using a live miner profitability ranking rather than a purchase-time estimate.
- Expected output against the network. Check that the site's monthly BTC tracks difficulty and pool share; if it does, every remaining variance question is a hardware question. The ViaBTC BTC Mining Pool state view and an income calculator cover both sides of that comparison.
Frequently asked questions
Is a bigger pool always better?
Size reduces payout variance but also concentrates hashrate. What matters more is fee structure, uptime, latency and payout cadence.
What happens if my miner goes offline?
Shares stop, so expected income stops with them. Alerts and a dashboard that shows per-worker hashrate shorten the gap between a failure and a fix.
How much hashrate variation is normal on a dashboard?
It depends on the window. With 100 shares counted, expect roughly ±10% of apparent variation; with 10,000 shares, about ±1%. Judge a deviation by whether it survives a full settlement period, not by how it looks in a five-minute graph.
Should I restart a miner when hashrate dips?
Only if the dip persists. Restarting costs minutes of real output and resets your diagnostic baseline, so require a deviation to survive at least one settlement period and to appear in the pool's own statistics first.
Set a threshold, then leave the graph alone
Decide in advance what counts as a fault: a deviation that persists through a full settlement period, or one that shows up in the pool's per-worker data rather than only in your own monitoring. Then let alerts do the watching and spend your attention on the two numbers that actually move income — realised hashrate against nameplate, and power cost per terahash. Everything else on the dashboard is either arithmetic or noise.
Data and sources: ViaBTC fee schedule[1], miner profitability ranking[2] and income calculator[3]. Network difficulty (132.76 T), network hashrate (1,003 EH/s), 450 BTC mined network-wide per day and the BTC/USD price of 84,692 come from public chain data and market feeds read on 21 September 2026; the share-noise relationship, outage costs and days-to-target figures are our own calculation from those inputs and are illustrative only. No outcome is guaranteed.